Introducing Quality Attenuation: Do ISPs deliver what their users need?
December 1, 2022
Internet Service Providers (ISPs) don’t know whether they are delivering what their customers need. There’s a very good reason for this troubling state of affairs: ISPs sell bandwidth but customers need applications to work well. Bandwidth is certainly important, but ISPs are mostly delivering enough bandwidth already. The relationship between bandwidth and application performance is not at all straightforward, as shown in a recent report by MIT and explained in this blog.
To do something about this problem, the Broadband Forum (BBF) published a new standard called TR-452.1 under the Quality Experience Delivered (QED) project. The standard describes how to measure Quality Attenuation. Quality Attenuation is powerful because it directly relates to the end-user-perceived quality of experience. It can also be used to find the root cause of performance problems, and to make sure Service Level Agreements (SLAs) are respected.
Quality Attenuation reframes network quality from “How much you can send (bandwidth)” to “How quickly and reliably you can send something (latency and packet loss)”.
TR-452.1 defines how to measure the above mentioned “quickly and reliably”, which in network mathematics are latency distributions and packet loss (that is what Quality Attenuation is) in enough detail to work out how well applications will work, and to diagnose problems when applications might fail. This is achieved by reporting latency and packet loss using probability distributions.
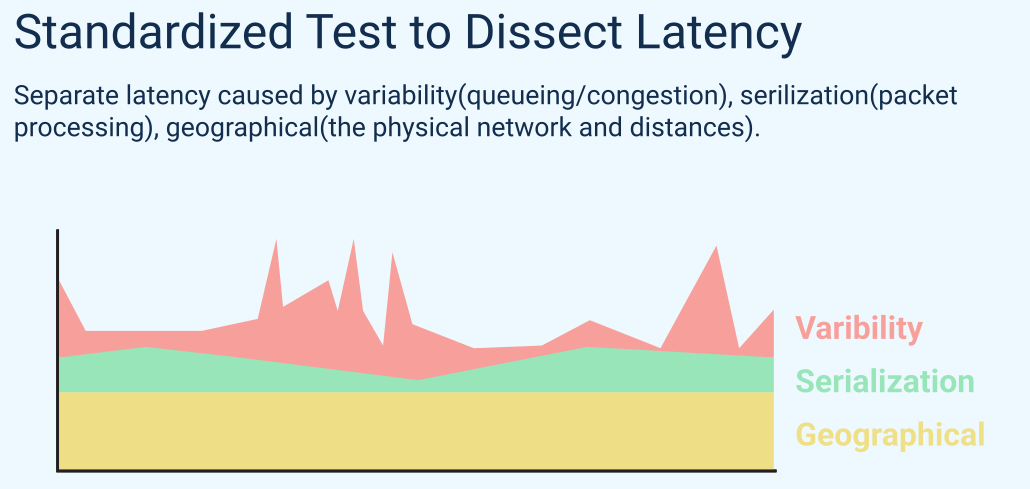
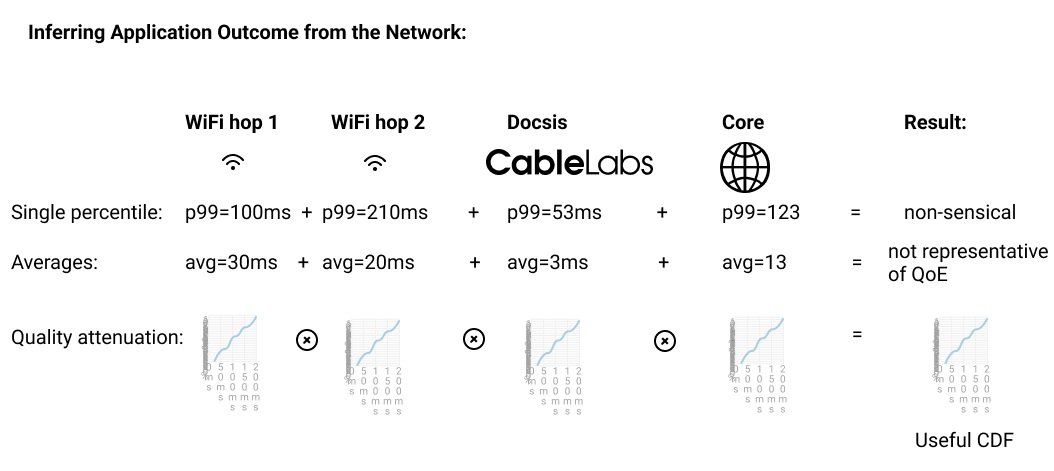
Quality Attenuation can be dissected into components (Geographical, Serialization and Variability) that represent different root causes. We can also add and subtract Quality Attenuation, so we can measure the performance of a WiFi link, the link to the ISP, and the link from the ISP to the server, and then add them up to compute the performance end-to-end. This is not possible with other metrics such as the 99th percentile of latency (the 99th percentile means 99 out of 100 samples have lower latency than the 99th percentile). Adding percentiles does not make sense mathematically. Average values can be added and subtracted but the result is not very useful because it does not relate to end-user-perceived performance. Quality attenuation does.
New answers to old questions
Quality Attenuation enables precise answers to questions we could only guess at before:
Is the network good enough for interactive traffic?
Gaming?
Video conferencing?
VR?
What is causing latency problems?
The distance to the server? (Geographical)
A low-bandwidth link? (Serialization)
Network congestion? (Variability)
Which network segment is causing the problem?
Which of two links is better for interactive traffic?
Running occasional speed-tests to measure bandwidth is not enough to ensure that the end-user experience is good because sudden increases in latency or packet loss can happen at any time. That is why Quality Attenuation is designed to constantly monitor running networks. Quality Attenuation can be measured using a very small amount of measurement traffic, and it can also be measured by passively observing existing traffic. The overhead costs of measuring are therefore kept to a minimum.
In summary: Quality Attenuation can give ISPs unprecedented insight into how well the network is working for their customers.